Orig. published Nov 2004, links updated July 2023
URL: http://www.kingcorn.org/research/psv/Update2004.html
Effect of Plant Spacing Variability on Corn Grain Yield
R.L. (Bob) Nielsen
Professor Emeritus
Agronomy Dept., Purdue Univ.
West Lafayette, IN 47907-2054
Email address: rnielsen at purdue.edu
Twitter: @PurdueCornGuy
Research Summary
- The results of large-scale field research during 2004 at a single location in northwest Indiana indicate that uneven plant spacing within rows decreases corn grain yield at a rate of approximately 2.2 bushels per acre for every inch increase in standard deviation of plant-to-plant spacing.
DISCLAIMER: Recognize that the following results are from a single location in a single year and, therefore, may not accurately predict future outcomes.
Plant spacing variability (PSV) can be described by the standard deviation (SD) of consecutive plant-to-plant spacings within rows. Field survey data collected from 354 fields in Indiana and Ohio during 1987-1996 suggested that the average commercial field of corn had a SD of about 4.5 inches and ranged from slightly less than 2.5 inches to more than 10 inches (Fig. 1).
NOTE: The standard deviation is a common statistical calculation used to describe variability within a set of values, in this case used to represent the variability among consecutive plant-to-plant spacings within rows of a corn field. Most computer spreadsheet programs can calculate the standard deviation of a group of values (i.e., a given range of data cells) with the use of a built-in mathematical function. For example, in Microsoft® Excel® the formula would be: =STDEV(cell range).
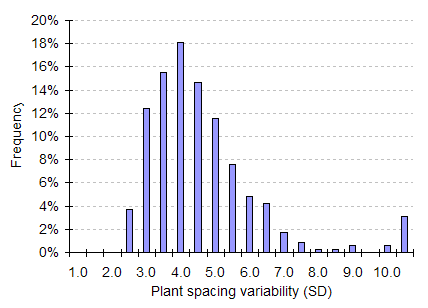
Fig. 1. Frequency distribution of plant spacing variability
(SD) among 354 surveyed commercial fields in Indiana
and Ohio, 1987-1996.
Lauer & Rankin (2004) surveyed 127 fields in Wisconsin from 1998-2000 for plant population and plant spacing variability. They reported an average SD of 3.3 inches with a range of 1.9 to 6.8 inches. Furthermore, 95% of the fields surveyed had SD less than 4.6 inches.
I first investigated the effects of PSV on corn grain yield in the late 80's and early 90's (Nielsen, 1991). The results of that field research suggested that yield loss due to uneven plant spacing averaged 2.5 bushels per acre (bpa) per inch increase in SD of plant spacing. The magnitude of yield loss observed over 8 site-years ranged from 1.2 to 4.5 bpa per inch of SD.
Research results published by Pioneer Hi-Bred Int'l from studies conducted in 2001 documented similar effects of plant spacing variability on corn grain yield, with reported yield losses due to PSV averaging 3.4 bpa per inch of SD (Doerge et al., 2002).
To be fair, not all research on the effects of uneven plant spacing has supported the conclusions made by yours truly or Doerge et al. (2002). Most everyone agrees that gaps within rows that not only cause higher plant spacing variability but also dramatically lower overall plant populations will typically lead to lower corn grain yields. Conversely, Nafiziger (1996) concluded that the net effect of double seed drops on grain yield may actually be positive up to some undefined upper threshold of plant population.
The disagreement occurs over the cumulative effects of mixtures of gaps and crowded plants in a field, especially when the resulting plant population is within the range considered to be optimum for corn grain yield (28- to 32,000 plants per acre). More recently, two separate papers published in 2004 concluded that the effects of plant spacing variability on corn grain yield were negligible in studies conducted in Wisconsin (Lauer & Rankin, 2004) and Ontario, Canada. (Liu et al., 2004a). Subsequent research published by the Ontario research group identified a significant linear yield loss due to uneven plant spacing equal to 1.5 bpa per inch of SD in a study that evaluated the effects of planting speed on stand uniformity (Liu et al., 2004b).
In response to these recent reports that disagree with the results observed in my earlier studies and those reported by Doerge et al. (2002), I decided to re-establish research in this area during the past 2004 growing season. Hybrids have changed and overall seeding rates have increased since I last studied this issue in the early 90's, so there was indeed a possibility that plant spacing variability was no longer an issue relative to corn grain yield. An ulterior motive was a desire to investigate this issue in larger-scale field plots rather than the traditional small-plot studies I conducted on this topic years ago.
Research Objectives
The objectives of the 2004 trial were 1) to verify whether we could reliably create repeatable levels of plant spacing variability in large-scale field plots using custom-manufactured seed discs and a commercial-sized air planter, and 2) to determine whether varying levels of plant spacing variability influence corn grain yield in large-scale field plots planted to a single, aggressive, seeding rate.
Research Procedures
In the research I conducted in the late 80's and early 90's, I created repeatable levels of PSV by plugging cells of seed discs of an air planter in pre-determined patterns and modifying the planter transmission setting accordingly to plant the desired target seeding rate. For the current study, with the collaborative assistance of Case IH engineers and agronomists, five sets of seed discs for use with a Case IH® 1200 ASM® air planter were custom-engineered with distinctive patterns of seed cell positions that would create predictable planting patterns of crowded seeds and gaps. The targeted PSV treatments resulting from the planted seed, when combined with a specific planting speed (4 mph) and seed disc revolution (35 rpm), were SD of 0-, 2-, 4-, 6-, and 8-inches.
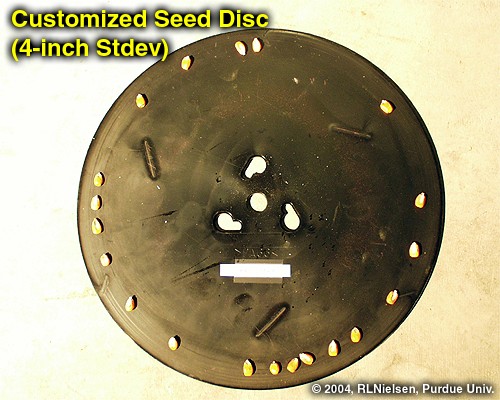
Prototype PSV treatment seed discs were tested at Case IH's Burr
Ridge, IL, engineering facility to verify that the actual seed drop
patterns matched the predicted patterns. Following the successful
completion of these tests, four complete sets of PSV treatment
seed discs were manufactured to accommodate an 8-row Case
IH 1200 ASM planter. An additional set of seed discs were
manufactured with 20 equally spaced seed cells that were used to
plant the control treatments whose targeted SD was zero.
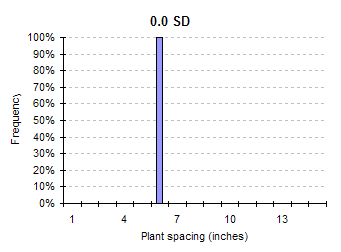
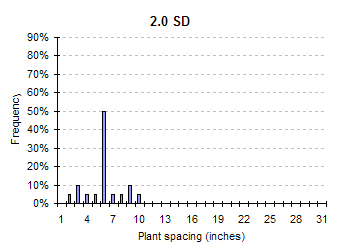
The targeted seeding rate for all of the intended PSV treatments was 34,848 seeds per acre (spa), which translates to an average plant-to-plant spacing of 6 inches. Because of physical seed spacing limitations on the seed disc, the closest mimic of a double seed drop that was achievable was a planted seed spacing of 2 inches. The predicted frequency distributions of plant-to-plant spacings for the five targeted PSV patterns are illustrated Fig. 2.
A 107-day relative maturity hybrid with fixed ear size characteristics and the YieldGard™ Bt-Rootworm trait (Diener 1076RW) was selected for the trial. The seed was pre-treated with an insecticide seed treatment (Poncho 250™) for protection against secondary insect pests (wireworm, seedcorn maggot, etc). A representative sample of the hybrid seed lot was analyzed at a commercial seed laboratory for warm germination (98%) and cold germination (97%) to verify the level of seed quality prior to the planting of the trial.
 A |
 B |
 C |
 D |
 E |
Fig. 2. Predicted frequency distributions of plant-to-plant spacings for the targeted PSV treatments of 0-, 2-, 4-, 6-, and 8-inch SD (A – E), based on a targeted seeding rate of 34,848 spa.
The location for the large-scale field trial was the Pinney-Purdue Agricultural Center, located in northwest Indiana near Wanatah. The approximately 17-ac field chosen for the trial had been previously grown to soybean and was prepared for planting with full width tillage. The trial was designed with the aid of GIS software and previously acquired geo-referenced field boundaries.
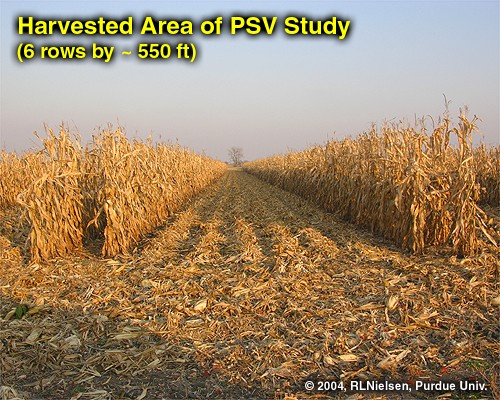
The five PSV treatments were replicated nine times in a randomized complete block design. Each plot was eight 30-inch rows (20 feet) by approximately 550 ft long with the intent of harvesting the center six rows. End rows and bulk areas of the field were planted to a non-Bt hybrid in concordance with EPA regulations for the establishment of Insect Refuge Management areas.
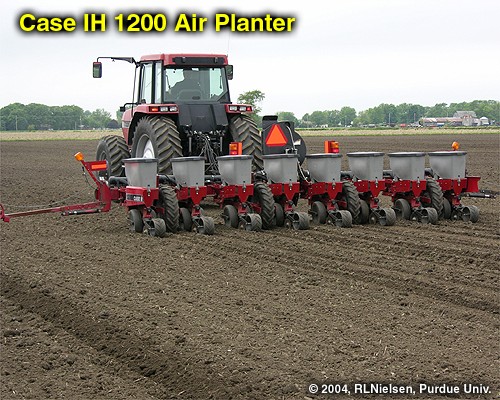 The trial was planted on 21 May with an 8-row Case IH 1200 ASM planter at a targeted seeding rate of 34,848 spa and a targeted seeding depth of 2 inches. Actual seeding rate and depth were verified in buffer plots prior to planting treatment plots. Neither planter-applied insecticide nor starter fertilizer was used for this trial. Nitrogen fertilizer (28% UAN) was sidedress-applied in mid-June at rates appropriate for the yield history of the field.
On 16 June, plant-to-plant spacings were recorded for 40 consecutive plants in each of two rows for each of two subsamples per plot. Plant stage of development on this date was V5 (five visible leaf collars) and very uniform among the plants throughout the trial. The average standard deviation and plant population were calculated for each plot.
The center six rows of each plot were harvested on 27 Oct with a Case IH 2366 combine equipped with an AgLeader® PF3000 Pro™ yield monitor and GPS receiver. Each plot's harvest was identified as a distinct yield monitor load. Grain moisture contents of subsamples from the first six loads were measured with a DICKEY-john® GAC2100 Agri™ moisture meter and used for calibrating the grain moisture estimates by the combine's grain moisture sensor. Grain harvested from the same six plots was weighed with a commercial weigh wagon and used to calibrate the wet weight estimates by the yield monitor, resulting in a yield monitor estimation error rate of only 0.2%. Grain weight and moisture content for the remainder of the plots were recorded solely by the yield monitor and downloaded to a handheld computer at the completion of the day's harvest.
 The yield data were initially processed via AgLeader's SMS Basic software using a 6.5 ft antenna front offset and a 12-sec grain flow shift. The latter value was based on visual observations of the average grain flow delay pattern for the yield data points at the beginning of each plot's harvest.
Following this initial processing of the data, yield data from the center 500 ft of each plot were extracted from the full yield dataset with the aid of ArcView GIS software. The purpose of this data extraction was to eliminate the usual “ramp up” and “ramp down” yield monitor effects that occur at the beginning and end of the yield monitor data for each plot.
Analyses of variance of the dataset were conducted with the aid of SAS-Stat software v8.2 (SAS Institute Inc., Cary, NC, USA). Where the analysis indicated statistically significant treatment effects, least significant difference (LSD) values were calculated at a 10% probability of error level and used for treatment mean comparisons. Simple linear regression was used to quantify the relationship between PSV and yield.
Results of the Trial
DISCLAIMER: Recognize that the following results are from a single location in a single year and, therefore, may not accurately predict future outcomes.
The custom-engineered planter seed discs did what they were designed to do; create repeatable treatment levels of plant spacing variability. The actual (measured) standard deviations of plant spacing for each targeted PSV treatment level were very close to what was predicted at the onset of the trial (Table 1). Only the targeted zero SD (control) treatment varied dramatically from its intended value. Even though seed singulation with the control treatment seed disc may have been perfect, subsequent movement of the seed from the seed meter to the furrow introduced some minimal level of spacing variability. Similar results were observed with the zero SD seed discs when tested in the laboratory prior to the study.
| Table 1. Actual (measured) SD of plant spacing (inches) for the five targeted (treatment) PSV levels. | ||
| Target SD | Actual SD | t grouping |
| 0 | 1.9 | E |
| 2 | 2.7 | D |
| 4 | 4.5 | C |
| 6 | 6.4 | B |
| 8 | 8.2 | A |
| LSD (P ‹ 0.10) | 0.2 | |
| The LSD value can be used to compare any pair of Actual SD means. Any pair of means followed by different letters in the "t grouping" column can be considered truly different and not an artifact of random chance or experimental error. | ||
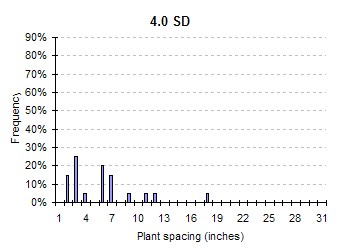
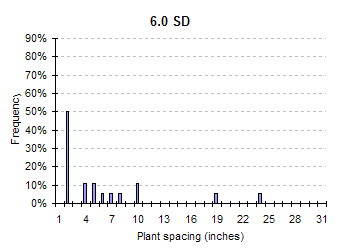
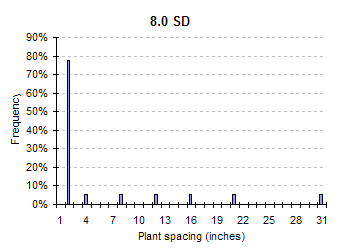
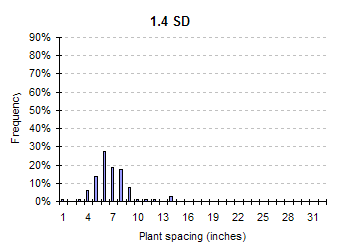
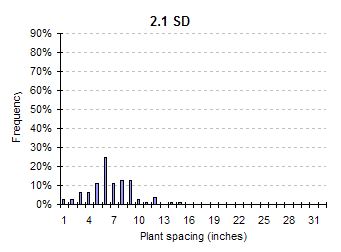
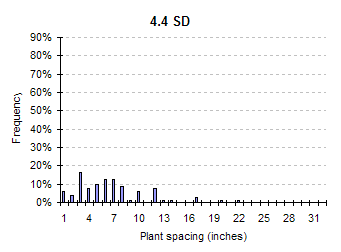
The frequency distributions of actual within-row plant spacings for each of the five targeted PSV treatments are illustrated in Fig. 3 for five representative individual plots. The contrast between predicted (Fig. 2) and actual plant spacing distribution (Fig. 3) is most evident for the zero SD (control) treatment, but is also evident to a lesser degree for the other four treatments. The good news, in my opinion, is that a) the actual SD of plant spacing closely matched the targeted SD for the treatments and b) the actual frequency distributions of plant spacings were less artificial (relative to the “real world”) than those predicted by the seed cell patterns of the customized seed discs.
 A |
 B |
 C |
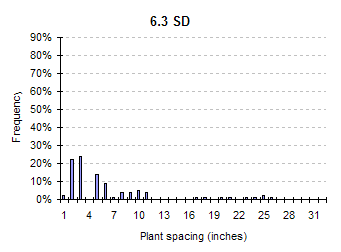 D |
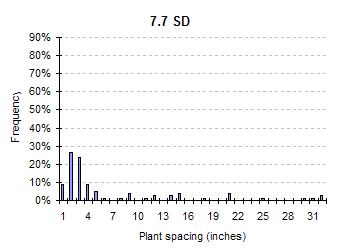 E |
Fig. 3. Frequency distributions of actual (measured) plant-to-plant spacings for five individual plots representing the 0-, 2-, 4-, 6-, and 8-inch SD treatments (A – E). The listed SD were those calculated from the individual plot data.
Final plant populations averaged about 95% (33,138 plants per acre) of the targeted seeding rate and were similar among the five targeted PSV treatments (Table 2). The similarity of final stands among the PSV treatments was exactly what was intended in order to avoid any confounding yield effects of uneven plant spacing with those of uneven plant populations.
| Table 2. Final plant populations (plants per acre) associated with the five targeted (treatment) PSV levels. | ||
| Target SD | Plant population | t grouping |
| 0 | 33,074 | A |
| 2 | 33,083 | A |
| 4 | 33,539 | A |
| 6 | 32,854 | A |
| 8 | 33,140 | A |
| LSD (P ‹ 0.10) | 913 | |
| The LSD value can be used to compare any pair of plant population means. Any pair of means followed by different letters in the "t grouping" column can be considered truly different and not an artifact of random chance or experimental error. | ||
Even though the average final plant populations were similar among the five PSV treatments, the plot-to-plot variability ranged from 31,000 plants per acre (ppa) to slightly more than 36,000 ppa. Fortunately, the variability for final stand among the 45 plots did not appreciably influence the actual (measured) plant spacing variability (Fig. 4).
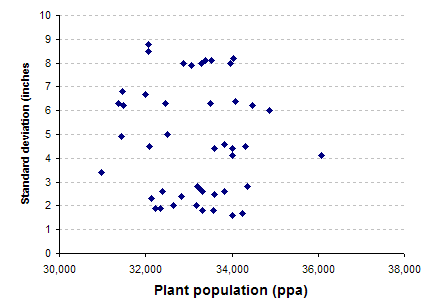
Fig. 4. Scatter graph of actual (measured) SD of plant
spacing (inches) versus final plant populations (ppa).
Data points represent average values for each of the
45 plots in the trial.
Grain yields overall were very good for the trial (186.3 bpa) considering the lateness of planting (21 May), moderate levels of silk clipping by corn rootworm beetles (Diabrotica virgifera) during pollination, and moderate levels of kernel abortion during the early stages of grain filling. The level of uncontrolled variability (i.e., “experimental error”) within the trial was also very minimal as documented by a coefficient of variation for grain yield of only 1.2.
Grain yields varied significantly among the five targeted PSV treatments, with the greatest yields occurring with the more uniformly spaced treatments and lowest yields occurring with the least uniformly spaced treatments (Table 3).
| Table 3. Grain yields (bpa, 15% moisture) associated with the five target PSV treatments. | ||
| Target SD | Grain yield | t grouping |
| 0 | 192.4 | A |
| 2 | 191.8 | A |
| 4 | 185.2 | B |
| 6 | 183.6 | B |
| 8 | 178.5 | C |
| LSD (P ‹ 0.10) | 1.7 | |
| The LSD value can be used to compare any pair of grain yield means. Any pair of means followed by different letters in the "t grouping" column can be considered truly different and not an artifact of random chance or experimental error. | ||
A significant negative linear relationship was identified between corn grain yield and actual (measured) SD of plant spacing in this trial that accounted for nearly 97% of the variability observed among treatment means for grain yield (Fig. 5). The rate of yield loss per inch of SD (2.2 bpa) was very similar to that which I observed in my original studies over 10 years ago (2.5 bpa), slightly less than that reported by Doerge et al. in their 2002 report (3.4 bpa), and slightly more than the 1.5 bpa reported most recently by Liu et al. (2004b).
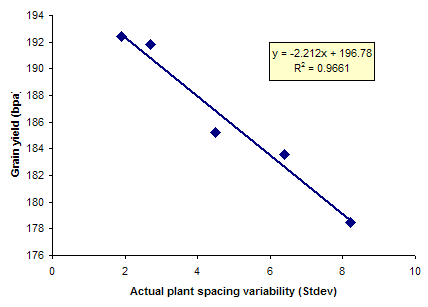
Fig. 6. Linear relationship between corn grain yield and
actual (measured) SD of plant spacing. Data points
represent treatment PSV means over nine replicates.
Conclusions
The results of this single year, single location trial support those observed more than 10 years ago over 8 site-years using different hybrids and lower seeding rates (Nielsen, 1991). They also agree (albeit at slightly different loss rates) with more recent results published by Doerge et al. (2002) and Liu et al. (2004b).
The results of this trial disagree with those published from trials in Wisconsin (Lauer & Rankin, 2004) and Ontario, Canada (Liu et al., 2004a). I can only speculate as to why my research supports the notion that uniform plant spacing is important for maximizing corn grain yields whereas other research in the upper Midwest and Canada does not.
One of the important criteria for studying the effect of PSV on corn grain yield is to strive to create the range of PSV at the time of planting to best capture any early-season effects on plant growth and development plus minimize any artificial effects to the plants due to alternative methods of creating PSV treatments. One critique of the recently published research from Wisconsin (Lauer & Rankin, 2004) and Ontario (Liu et al., 2004a) is that the PSV treatments were created after the plants had emerged.
Lauer & Rankin (2004) overplanted at a seeding rate of approximately 90,000 spa and hand-thinned at the five to six leaf collar stage of development to desired PSV treatments at final populations of 30,000 ppa. Liu et al. (2004a) overplanted targeted blends of glyphosate-tolerant and normal corn seed at seeding rates ranging from about 28- to 47,000 spa; then sprayed the plots with glyphosate at approximately the one leaf stage of development to eliminate the normal seedlings and create varying PSV levels at final populations of about 28,000 ppa.
Another important criterion for studying the effects of PSV on corn grain yield is to strive to create repeatable (among the replicates of the study) PSV treatments that also closely mimic that which occurs in the "real world". This is not easy to accomplish. The Wisconsin research successfully created repeatable PSV treatment levels, but defined them in terms of distinct 2-, 4-, or 8-plant patterns that do not resemble PSV that occurs in actual corn fields. The closest plant-to-plant spacing achievable with the Ontario research methodology (Liu et al., 2004a) was only 4.4 inches and varied from 4.4 to 6.8 inches (depending on the PSV treatment); quite different from true double seed drops that may be only 1 to 2 inches apart.
An advantage with the experimental technique used in my research is that I believe my methodology for emulating PSV is closer to "real world" situations than those implemented in either the Wisconsin and Ontario studies. In addition, differences obviously exist between central and northern Corn Belt locations for relative hybrid maturity and growing season climatology that may influence the yield response of corn to uneven plant spacings.
Plans for Future Research
The 2004 trial in northwest Indiana was basically a prototype year to primarily determine the reliability of the experimental approach to mimicking "real world" PSV situations in large-scale field trials. My goal for 2005 is to expand this large-scale field trial to several other outlying Purdue research centers (northwest, northeast, eastcentral, and southeast) and include hybrids that represent both fixed and flex-ear size characteristics.
Acknowledgements
I greatly appreciate the collaboration with Case IH on this project, especially for the use of the Case IH planter & tractor, the working relationships with Norm Larson and Chuck Johnson, the assistance provided by Ben Coats and Mike Pruett, plus the support of Monte Weller. I also extend a sincere thanks to the staff of the Pinney-Purdue Ag. Center: Jon Leuck, superintendent; Justin Grimble; and Mark O'Neal. Without their able assistance and support, I could not have conducted this project. Finally, I sincerely appreciate the donation of ten units of hybrid seed corn by Diener Seeds Inc. (courtesy of Dan Childs, Director of Agronomic Services and Product Development) for this project.
Related References
Doerge, Tom, Tom Hall, and Doug Gardner. 2002. New Research Confirms Benefits of Improved Plant Spacing in Corn. Crop Insights Vol. 12, No. 2. Pioneer Hi-Bred Int'l, Johnston, IA. Available online at https://studylib.net/doc/7585349/benefits-of-improved-plant-spacing-uniformity. (URL accessed July 2023).
Lauer, Joseph and Mike Rankin. 2004. Corn Response to Within Row Plant Spacing Variation. Agron. J. 96(5):1464-1468.
Liu, Wiedong, Matthijs Tollenaar, Greg Stewart, and William Deen. 2004a. Within-Row Plant Spacing Variability Does Not Affect Corn Yield. Agron. J. 96(1):275-280.
Liu, Wiedong, Matthijs Tollenaar, Greg Stewart, and William Deen. 2004b. Impact of Planter Type, Planting Speed, and Tillage on Stand Uniformity and Yield of Corn. Agron. J. 96:1668-1672.
Nafziger, E.D. 1996. Effects of missing and two-plant hills on corn grain yield. J. Prod. Agric. 9:238-240.
Nielsen, R.L. (Bob). 1991 (Rev. 2001). Stand Establishment Variability in Corn. Purdue Univ. Agronomy Dept. publication AGRY-91-01. Available online at https://www.agry.purdue.edu/ext/pubs/AGRY-91-01_v5.pdf. (URL accessed July 2023).