January 2025
Interpreting Corn Hybrid Maturity Ratings in the U.S.
Click image to view larger version.

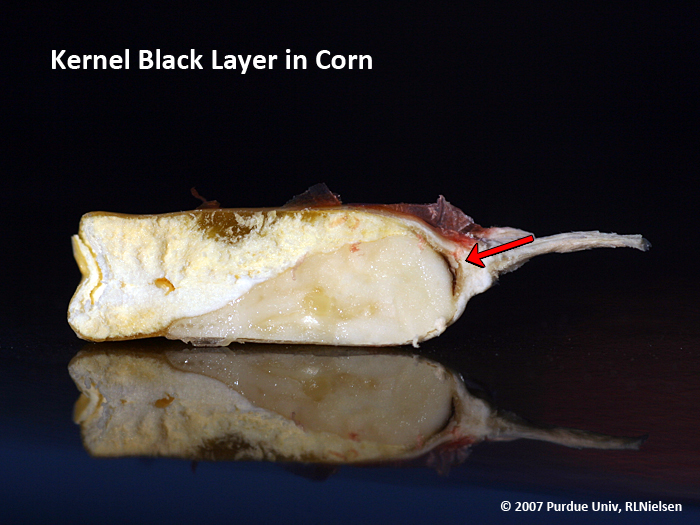
Fig. 1. Kernel black layer in corn.
The concept of hybrid maturity ratings is intuitive to anyone familiar with corn varieties. We understand that some hybrids mature earlier in the fall than do others, thus we describe hybrids as being early maturity (short-season) or late maturity (full-season). However, sometimes the numeric ratings companies assign to hybrids... e.g., 110 CRM, 106-day, 2560 GDD... are less intuitive and border on the mysterious. Some of the mystery is due the fact that different maturity rating methods are sometimes based on different definitions of "maturity".
Agronomists usually refer to "maturity" as that point at the end of the grain filling period when maximum weight per kernel has occurred. The usual term for this is "physiological maturity" and is associated with the development of the black layer at the tip of the mature kernel (Nielsen, 2021; Fig. 1). Grain moisture content at physiological maturity varies year to year for individual hybrids depending on growing conditions but can also vary hybrid to hybrid. Grain moisture content at the onset of physiological maturity typically ranges between 25 and 35 percent, though black layer can occur at grain moistures as high as 40 percent.
Another definition of "maturity" is that point in time AFTER physiological maturity when corn can be safely harvested with minimal kernel loss or kernel damage. This is typically termed "harvest maturity" and is usually associated with grain moisture contents no higher than 25 percent. Note this is not necessarily the most profitable moisture content, but the corn can technically be harvested with minimal harvest loss and so the grain is "harvest mature".
Hybrid Relative Maturity
One method commonly used in the U.S. for assigning hybrid RELATIVE maturity (RM) ratings is based on the knowledge that grain drydown in the field, after physiological maturity, is fairly linear and predictable (Nielsen, 2018). For example, grain moisture loss in the field during early to mid-September across much of Indiana averages about 0.5 percentage point loss per day. Yes, it can range as high as 1.0 point per day under sunny and unusually warm conditions or as low as 0.25 point per day with cloudy, cool conditions but an average of 0.5 point per day describes the drydown rate pretty well.
Consequently, a seed company can compare the grain moisture of a new hybrid at harvest with that of an existing hybrid with an established RM harvested the same day. Conceptually, hybrids with higher grain moisture content than the "check" hybrid at "harvest maturity" are fuller season hybrids and vice versa. For example, if the grain moisture content of a new hybrid was 1 point drier than that of an existing hybrid with an established RM of 110, the new hybrid could be assigned a RM of 108, i.e., 2 fewer days of drydown at 0.5 percentage point per day.(Emmert, 2020)
NOTE: Historically, folks have added the word "days" to hybrid RM ratings (e.g., 108-day hybrid), but recognize that the RM value does not literally refer to actual calendar time between planting and "harvest maturity". For example, a typical 111-"day" hybrid planted in westcentral Indiana on April 20 will reach physiological maturity in about 145 days, but can range from about 130 to 170 days depending on the growing season (Andresen et al., 2025). The number of calendar days from planting to "harvest maturity" is even greater because of the additional time required for mature grain to dry to harvestable moisture contents.
Hybrid GDD Maturity
The other common method for rating hybrid maturities is based on the cumulative thermal time between planting and physiological maturity. Terms used to describe thermal time include "growing degree days" (GDD), "growing degree units" (GDU) and "heat units" (HU)(Nielsen, 2020). Growing degree day values represent the amount of heat accumulated over a period of time. Since this maturity rating method depends on measurement of thermal time, there is no need to compare hybrids in order to assign GDD maturity ratings. In other words, the GDD maturity rating for an individual hybrid stands on its own and does not rely on the maturity ratings of "check" hybrids. Typical GDD ratings (Fahrenheit-based) for hybrids commonly grown in Indiana range from about 2500 (earlier maturity hybrids) to 2800 GDD (later maturity).
The mathematical relationship between RM ratings and GDD ratings within any given company's hybrid lineup is close but not exact because each rating system relies on a different methodology (relative vs. thermal time) and different "end points" to the growing season (harvest maturity vs. physiological maturity). If two hybrids require the same number of GDD to reach physiological maturity (kernel black layer) but their rates of post-maturity field drydown differ, they may be assigned the same GDD rating, but different RM ratings. Neither maturity rating method is precise because of the influences of climatic conditions and plant stress on crop development rates and post-maturity drydown in the field.
An example of the mathematical relationship between GDDs to physiological maturity and hybrid RM ratings is illustrated in Fig. 2 for a group of 62 Pioneer® brand hybrids adapted to the central Corn Belt that I randomly selected from Pioneer's online corn catalog (Pioneer® Seeds|United States, 2025). For that group of hybrids, every 1 "day" increase in relative maturity is equal to about 22 GDDs. Interestingly, a Minnesota trial that evaluated the GDD to RM relationship for 480 hybrids adapted to the northern Corn Belt also documented a 22 GDD per day increase for every "day" increase in hybrid RM (Coulter, 2021).
DISCLAIMER: Reference to any seed company in this article does not constitute an endorsement of said seed company by me or Purdue University. The public availability of said seed company's hybrid maturity ratings simply facilitated the mathematical manipulations described in this article.
Inconsistencies in Methodologies
Unfortunately, there are no agreed upon standards across the seed industry for using either hybrid maturity rating method. Since relative maturities are, well, relative to "check" hybrids, differences in how seed companies determine or assign the RM of their "check" hybrid result in differences in RMs between companies for genetics that are actually similar in maturity. Furthermore, not all seed companies use "planting to black layer" as the time period for determining GDD accumulation. Some companies use GDDs accumulated from "emergence to black layer" instead. The difference in company hybrid GDD "ratings" between two otherwise similar genetics could be about 120 GDDs, equal to the heat units typically required for corn to emerge after planting.
Bottom Line
- Hybrids often vary in the time required to reach maturity.
- Maturity differences can be casually described as early, mid, and late maturity.
- Maturity differences can be quantified relative to known standard hybrids (e.g., 108 vs. 110 RM).
- Maturity differences can be quantified as thermal time to physiological maturity (e.g., 2600 GDD).
- Maturity rating comparisons within a seed company's hybrid lineup are more reliable than maturity rating comparisions between hybrids of different seed companies.
Cited or Related References
Andresen, Jeff, Jim Angel, Larry Biehl, Roger Elmore, Beth Hall, Chad Hart, Tom Hultquist, Ray Massey, Chris Panza, Brian Raub, Martha Shulski, Dennis Todey, Melissa Widhalm, Ray Wolf. 2025. U2U Decision Support Tools - Corn GDD. Midwest Regional Climate Center. https://mrcc.purdue.edu/tools/corngdd [accessed Jan 2025].
Coulter, Jeff. 2021. Selecting corn hybrids for grain production. Univ. Minnesota Extension. https://extension.umn.edu/corn-hybrid-selection/selecting-corn-hybrids-grain-production [accessed Jan 2025].
Emmert, Daniel. 2020. Corn Maturity: The Differences Between Hybrid CRM Scores. Pioneer® Seeds U.S. https://youtu.be/5tI7g8i3DN4?si=EpUcQuoqsoovYLhY [video accessed Jan 2025].
Nielsen, R.L. (Bob). 2018. Field Drydown of Mature Corn Grain. Corny News Network, Purdue Extension. http://www.kingcorn.org/news/timeless/GrainDrying.html [accessed Jan 2025].
Nielsen, R.L. (Bob). 2020. Heat Unit Concepts Related to Corn Development. Corny News Network, Purdue Extension. [online] http://www.kingcorn.org/news/timeless/HeatUnits.html [accessed Jan 2025].
Nielsen, R.L. (Bob). 2021. Grain Fill Stages in Corn. Corny News Network, Purdue Extension. [online] http://www.kingcorn.org/news/timeless/GrainFill.html [accessed Jan 2025].
Pioneer® Seeds|United States. 2025. Pioneer Corn Product Catalog. https://www.pioneer.com/us/product-catalog/crop-corn.html [accessed Jan 2025].