Updated June 2025
Maximum Weekly Planting Progress for Corn and Soy in Indiana:
Has It Changed Over Time?
R.L. (Bob) Nielsen
Professor Emeritus & Retired Extension Corn Specialist
Agronomy Dept., Purdue Univ.
West Lafayette, IN 47907-2054
Email address: rnielsen at purdue.edu
- Fact: Corn and soybean planting equipment is larger than 30 years ago.
- Fact: Individual farmers can plant more acres per day than 30 years ago.
- Conundrum: Maximum statewide weekly planting progress has changed little over 30 years.
 he number of 30-, 40-, and 60-ft wide (or larger) field crop planters across the U.S. Midwest is greater today than 30 years ago. Certainly, individual farmers can plant more acres of corn and soybean per day with today's large field equipment than they could 30 years ago. Consequently, it seems logical that the capability to plant more crop acres per week statewide has also increased. As is often the case with "logical conclusions", the historical data do not necessarily support the logic. Historical planting progress data suggest that the maximum number of corn and soybean acres planted per week in Indiana has not changed much over the past 30 years.
The greatest number of corn acres planted in a single week in Indiana during the past 30 years occurred in 2001 when 2.9 MILLION acres or 50% of the total acreage for that year were planted in a single week (Fig. 1). Since 2001, the closest Indiana farmers have come to matching that progress was during the 2014 planting season when 41% of the total corn acreage or 2.4 million acres were planted during a single week (Fig. 1).
The most soybean acres planted in a single week in Indiana during the past 30 years also occurred in 2001 when 2.4 million acres or 42% of the total acreage for that year were planted in a single week (Fig. 2). Since then, the closest Indiana farmers have come to matching that progress was during the 2016 planting season, when 1.8 million acres or 32% of the total soybean crop were planted during a single week (Fig. 2).
Looking at the historical planting progress of each crop individually (Fig's 1 and 2) suggests that little improvement has been made in our ability to plant a lot of crop acres quickly on a statewide basis. Some have countered that the potential maximum COMBINED acres planted per week (corn plus soybean) has surely increased because farmers are increasingly planting soybean at the same time as they are planting corn, in contrast to previous decades when maximum soybean planting occurred near the end of corn planting. The latter fact is true. Weekly soybean planting progress more closely mirrors that of corn in recent years than in previous years (Figs. 3 & 4). However, that has not resulted in greater maximum weekly planting progress for the two crops combined.
During the past 30 years in Indiana, the greatest number of corn AND soybean acres planted in a single week was also 2001, when 5.25 million acres of the two crops (46% of the total acres) were planted in a single week (Fig. 5) and coincided with the weeks of maximum planting progress for each crop (Figs. 1 & 2). From a historical perspective, such an achievement over a week's time borders on phenomenal. During the ensuing 20+ years, though, Indiana farmers have not come close to matching that planting record. Since 2001, the maximum number of corn plus soybean acres planted in a single week has averaged 2.6 million acres, has been very erratic year to year, and shows no appreciable increase over time (Fig. 5).
If one looks at the combined acreage of corn and soybean planted during the TWO (2) weeks of maximum planting progress each year, the greatest statewide progress occurred in 1999 and 2001 when 7.5 million acres were planted over two consecutive weeks in each year, which represented 66% of the total combined corn and soybean acres each year (Fig. 6). Those examples of planting progress are also phenomenal but have not been matched in the ensuing years.
So, given the realities of ever larger planting equipment over the years and the fact that farmers are increasingly planting both crops at the same time, the conundrum is this... Why has the actual weekly planting progress of the two crops changed very little over the past 30 years? The answer does not appear to be related to changes in total crop acres planted in Indiana because that number has remained fairly constant at just over 11 million acres during that time period (Fig. 7).
One might speculate that the number of suitable days for fieldwork has decreased over time and maybe that is why maximum weekly statewide planting progress has not increased over time. Certainly, many farmers joke that abnormal weather is now the "new normal". Teasing out historical trends for this factor is difficult, partly because a sunny day does not mean the soil is suitable for fieldwork. Weather AND soil conditions dictate the number of days available during any given week for fieldwork. USDA-NASS (2025b) defines "Days Suitable for Fieldwork" as days "...where weather and field conditions allowed producers to work in fields a major portion of that day" Estimates of days suitable for fieldwork are published weekly during the growing season by USDA-NASS (2025a).
Working with the Indiana dataset from 1995 - 2025 (USDA-NASS, 2025c), I calculated for each year the average number of days per week suitable for fieldwork during the 4-week period between mid-April and mid-May (Fig. 8). That time period represents the prime agronomic planting window for corn and soybean in Indiana. The data shown in Fig. 6 suggest that the number of days suitable for fieldwork is 1) very erratic year to year and 2) has not changed much over the past 30 years. Consequently, this factor does not seem to explain the fact that the adoption of ever larger planters has not resulted in higher weekly statewide planting progress.
The answer to the large planter vs. planting progress conundrum may simply be the fact that the number of corn and soybean growers in Indiana has decreased over time and those remaining are farming more acres than they did 30 years ago. Even though farm machinery is larger today and covers more acres per day than 30 years ago, the fact that there are fewer farmers farming the same number of total acres statewide may explain why the statewide planting progress remains fairly unchanged. Irwin (2022) essentially came to the same conclusion for historical corn and soybean planting progress data in Illinois.
Citations & Related reading
Irwin, Scott. 2022. What Do We Know About How Long It Takes to Plant the U.S. Corn Crop? farmdocDAILY, Univ. of Illinois. https://farmdocdaily.illinois.edu/2022/04/what-do-we-know-about-how-long-it-takes-to-plant-the-us-corn-crop.html [accessed June 2025].
USDA-NASS. 2025a. Crop Progress. USDA Nat'l Ag. Statistics Service. https://usda.library.cornell.edu/concern/publications/8336h188j [accessed June 2025].
USDA-NASS. 2025b. National Crop Progress - Terms and Definitions. USDA Nat'l Ag. Statistics Service. https://www.nass.usda.gov/Publications/National_Crop_Progress/Terms_and_Definitions/index.php [accessed June 2025].
USDA-NASS. 2025c. Quick Stats. USDA Nat'l Ag. Statistics Service. https://www.nass.usda.gov/Quick_Stats/ [accessed June 2025].
Click image to view larger version in a popup window. Left or right arrow on your keypad will cycle through the popup images.

Fig. 1. Acres (actual and percent of total) of field corn planted during the week of maximum planting
progress in Indiana, 1995-2025. Note that the specific week of maximum corn planting progress varies
one year to another. Data derived from USDA-NASS Crop Progress Reports.

Fig. 2. Acres (actual and percent of total) of soybean planted during the week of maximum planting
progress in Indiana, 1995-2025. Note that the specific week of maximum soybean planting progress
varies one year to another. Data derived from USDA-NASS Crop Progress Reports.
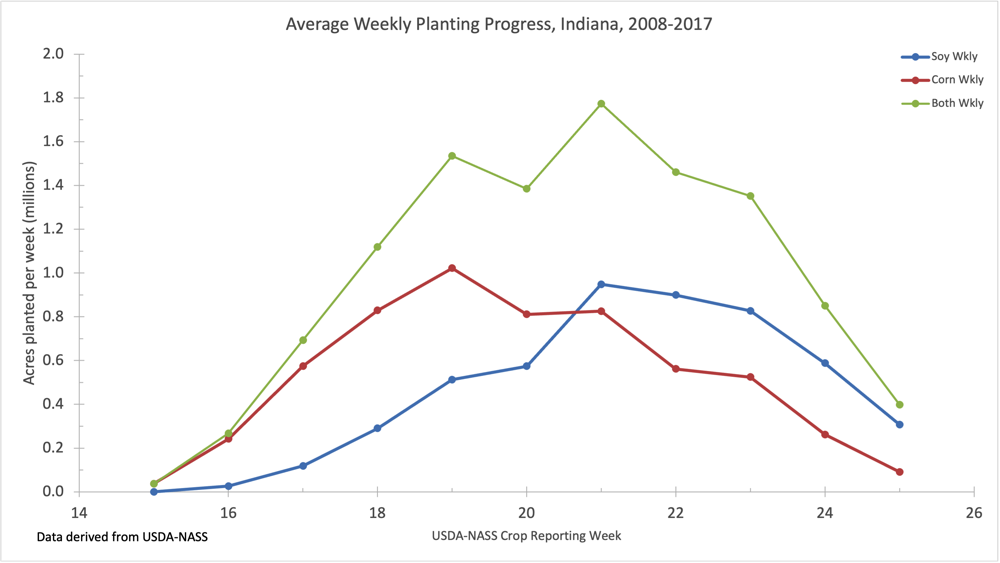
Fig. 3. Average weekly planting progress for corn and soybean in Indiana, 2008-2017.
Data derived from USDA-NASS Crop Progress Reports.
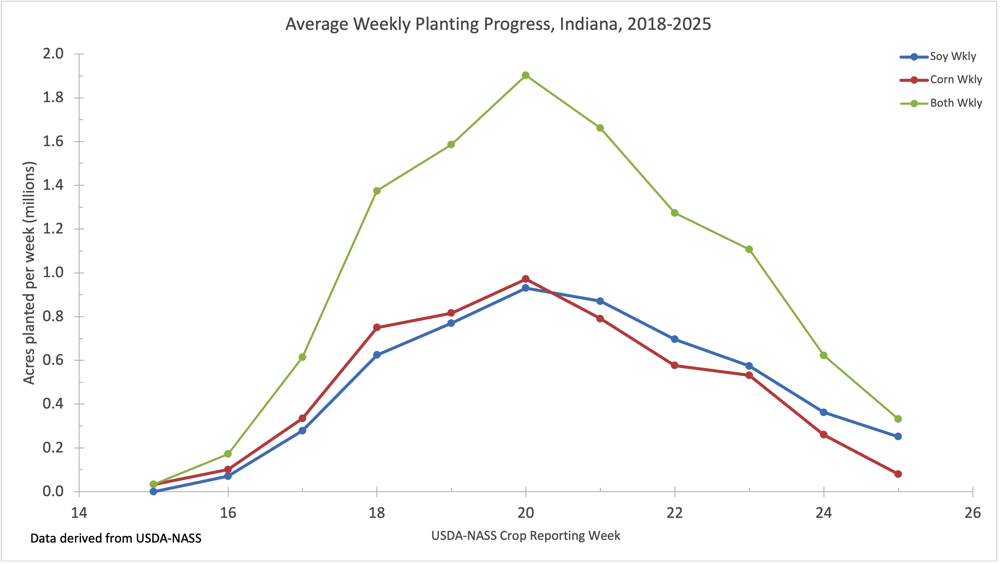
Fig. 4. Average weekly planting progress for corn and soybean in Indiana, 2018-2025.
Data derived from USDA-NASS Crop Progress Reports.
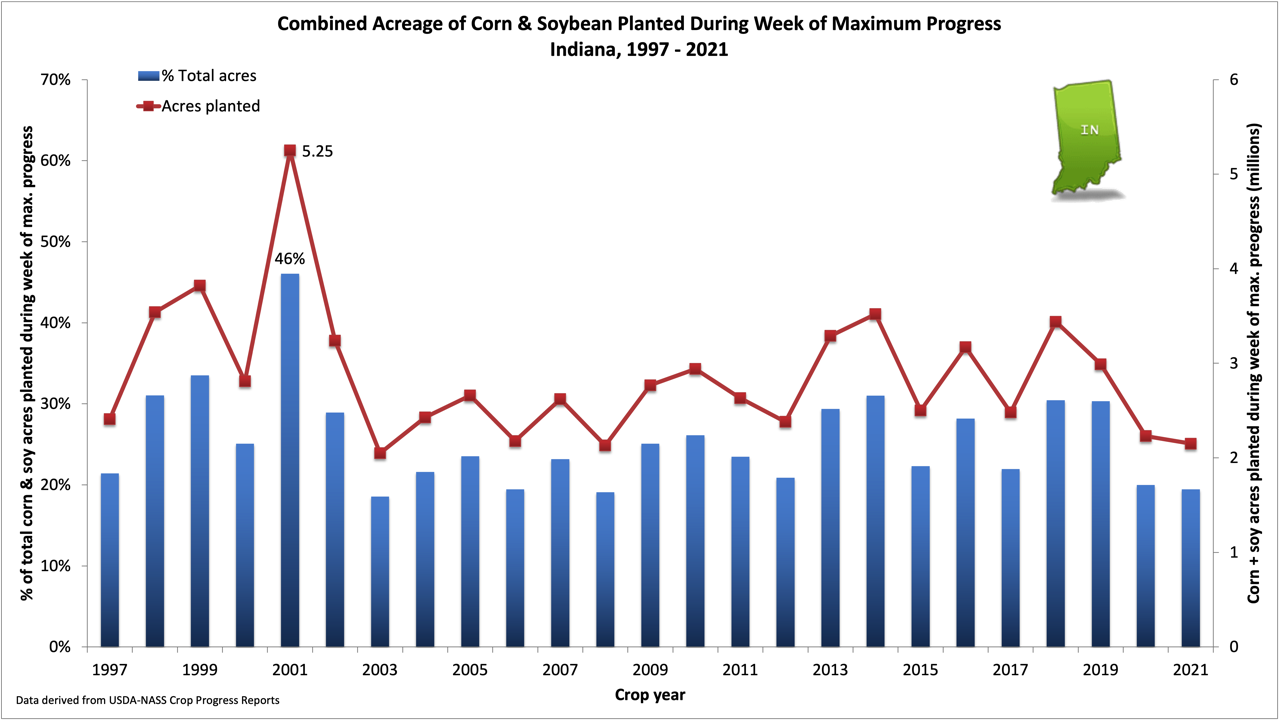
Fig. 5. Acres (actual and percent of total) of field corn plus soybean planted during the single week
of maximum combined planting progress in Indiana, 1995-2025.
Data derived from USDA-NASS Crop Progress Reports.
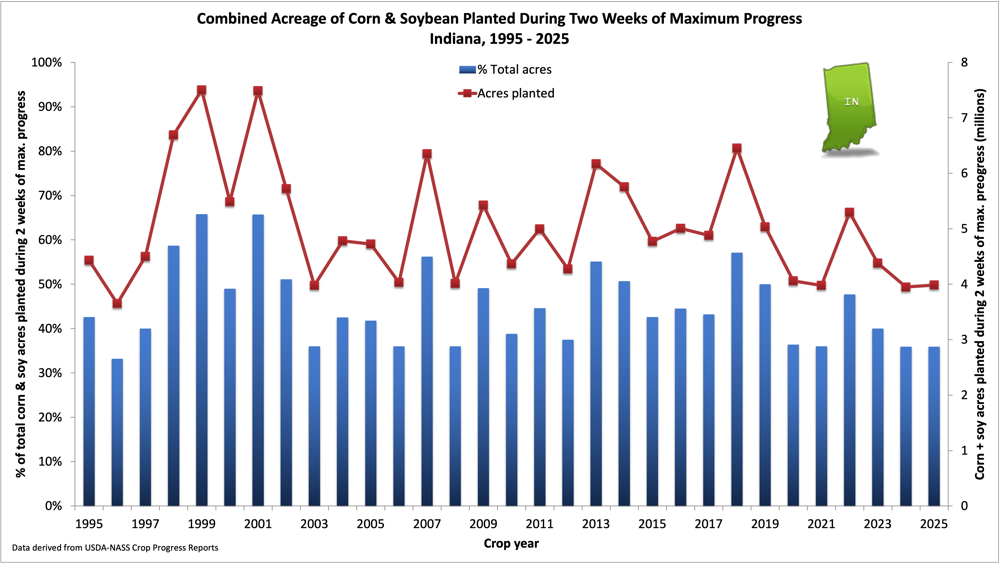
Fig. 6. Combined acres (actual and percent of total) of field corn and soybean planted during the two
weeks of maximum combined planting progress in Indiana, 1995-2025.
Data derived from USDA-NASS Crop Progress Reports.
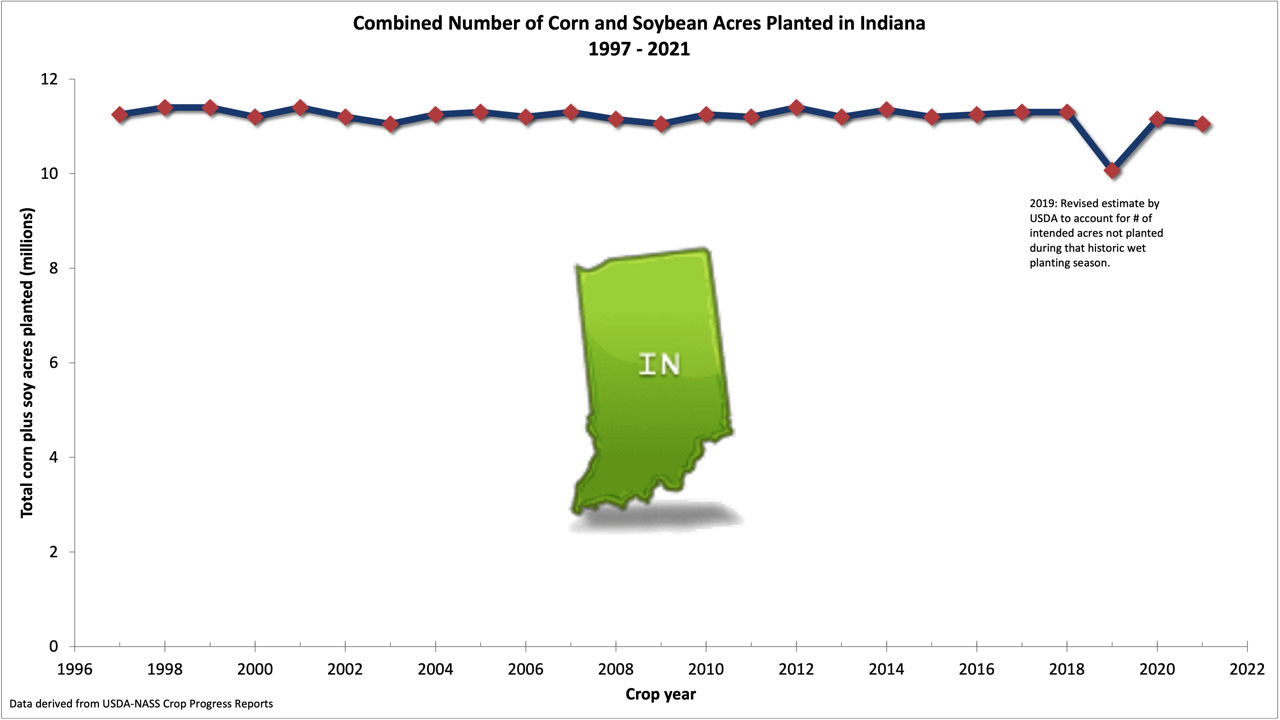
Fig. 7. Combined number of acres planted annually to corn and soybean in Indiana, 1995-2025.
Data derived from USDA-NASS Crop Progress Reports.
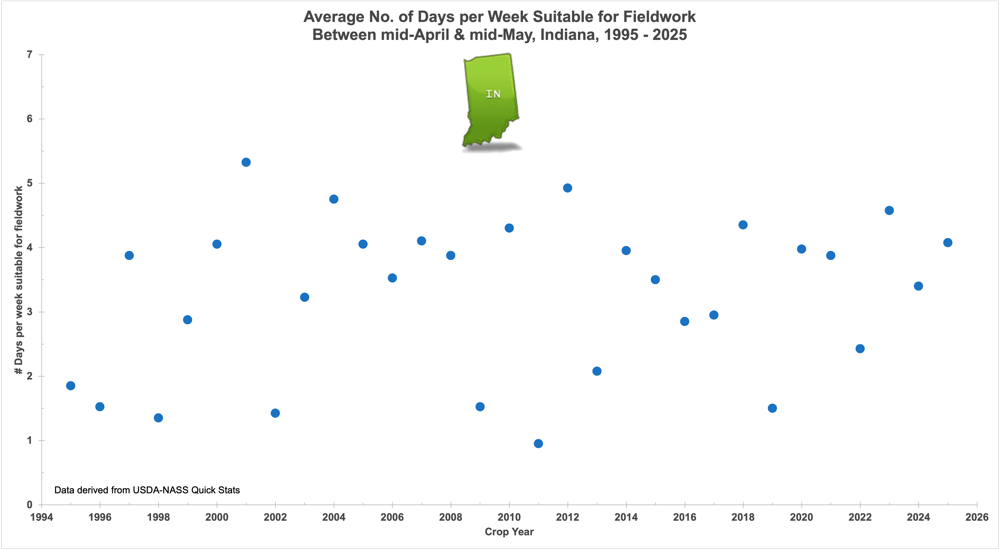
Fig. 8. Average number of suitable days per week for fieldwork in Indiana between mid-April and
mid-May from 1995 to 2025. Data derived from USDA-NASS Quick Stats.
END OF DOCUMENT