24 July 2014
URL: http://www.kingcorn.org/news/articles.14/CoolTemps-0724.html
Cool Temperatures & Grain Yield: Déjà vu for Corn?
R.L. (Bob) Nielsen
Agronomy Dept., Purdue Univ.
West Lafayette, IN 47907-2054
Email address: rnielsen
at purdue.edu
Global warming aside, much of Indiana has experienced a cool summer to date (Fig. 1). As Yogi Berra once said, "It's like déjà vu all over again" relative to the questions folks have been asking recently about the consequences, good or bad, of such cool temperatures on the prospects for corn grain yields at harvest this fall. Similar questions were raised only a few years ago (2009) in another recent cool growing season (Nielsen, 2009).
So............. what about the 2014 growing season and its cool temperatures? One needs to be cautious making comparisons with the 2009 growing season, especially with regard to the unpleasant harvesting experience of 2009.
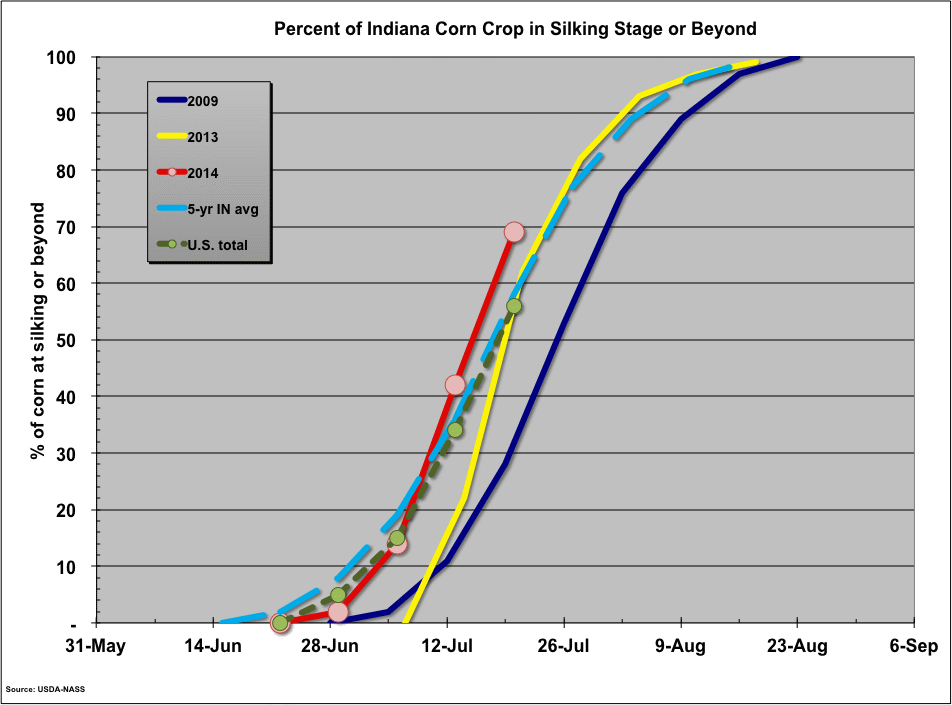
Certainly, both growing seasons were cool through to about this time in July (Fig's 1 & 2), and 2009 continued to be cool throughout much of the remaining part of that summer (Fig. 2) and into early fall. However, corn planting statewide was considerably delayed in 2009 versus the 5-year average (Fig. 3). Early season cool temperatures in 2009 sustained the delayed crop progress, resulting in about a 7-day later statewide silking period in 2009 versus the 5-year average (Fig. 4). Subsequent cool temperatures in August and September further delayed grain maturity in 2009 to nearly two weeks later than the 5-year average (Fig. 5). Coupled with poor conditions for grain drying in the field prior to harvest plus the development of ear rots and mycotoxins, grain harvest was pretty miserable for many growers in 2009. Nevertheless, estimated statewide grain yield in Indiana for 2009 set a new state record at 171 bu/ac that was not exceeded until last year's record yield of 177 bu/ac (USDA-NASS, 2014b).
So........... again, the question lingers about the 2014 growing season and its cool temperatures to date. The honest answer to that question is..... "time will tell", because the next 60 days will decide whether this crop finishes as strong as much of it looks today or falters in response to yet unknown weather extremes and/or diseases.
The good news
- While the onset of planting was delayed in 2014, the majority of the crop was planted ahead of the 5-year average pace (Fig. 3), in contrast to the overwhelming late planting of 2009.
- While the cool temperatures to date most certainly have slowed the progress of the crop, the statewide pace of silking (as of 20 July) remains slightly ahead of the 5-year average (Fig. 4).
- Stand establishment (plant population and initial uniformity) appears to have been excellent throughout the state, except for fields or areas within fields that sustained damage from excessive rainfall earlier in the season.
- Moderate temperatures and, mostly, adequate soil moisture during this critical pollen shed and silking period have certainly been favorable for successful pollination and kernel set.
- The current monthly weather outlooks for August through September for Indiana (NWS, 2014) suggest "normal" temperatures (not excessively hot or excessively cool) and normal rainfall (not excessively wet or excessively dry), which would certainly bode well for the important grain filling period (kernel weight) and for minimizing the risk of further delay in the progress of the crop as it moves toward maturity.
- Foliar disease levels, to date, remain moderate in most fields with some exceptions.
- Many of the record high corn grain yield years in Indiana have been those with moderate, if not cool, temperatures during the growing season.
Potential bad news
- Any potential bad news depends on weather, diseases (including ear rots), and the adequacy of soil nitrogen for finishing the crop without any undue photosynthetic stress during the grain filling period (Nielsen, 2014).
Click on images to view larger versions. NOTE OF CAUTION: The first two graphs were auto-generated on the MRCC Web site. The temperature and rainfall axis scales differ slightly for each year's graph, so be careful when visually comparing one year with the other.

Fig. 1. Daily rainfall and max / min air temperatures for June and
July, 2014 in westcentral Indiana. Source of graph: Midwest Regional
Climate Center.

Fig. 2. Daily rainfall and max / min air temperatures for June through
August, 2009 in westcentral Indiana. Source of graph: Midwest Regional
Climate Center.

Fig. 4. Silking progress of corn in Indiana for 2014 (as of 7/20) and
select years. Data: USDA-NASS.
Related reading
MRCC. 2014. cli-MATE Database. Midwest Regional Climate Center, Champaign, IL. http://mrcc.isws.illinois.edu/CLIMATE [URL accessed July 2014].
NWS. 2014. Climate Prediction Center. National Weather Service. http://www.cpc.ncep.noaa.gov/index.php [URL accessed July 2014].
Nielsen, RL (Bob). 2009. Cool Temperatures: Good News or Bad News for Corn? Corny News Network, Purdue Extension. http://www.kingcorn.org/news/articles.14/YieldProspects-0715.html [URL accessed July 2014].
Nielsen, RL (Bob). 2014. Prospects for the 2014 Indiana Corn Crop. Corny News Network, Purdue Extension. http://www.kingcorn.org/news/articles.09/GoodNewsBadNews-0721.html [URL accessed July 2014].
USDA-NASS. 2014a. Crop Production Annual Summary. USDA National Agricultural Statistics Service. http://usda.mannlib.cornell.edu/MannUsda/viewDocumentInfo.do?documentID=1047 [URL accessed July 2014].
USDA-NASS. 2014b. Crop Progress. USDA National Agricultural Statistics Service. http://usda.mannlib.cornell.edu/MannUsda/viewDocumentInfo.do?documentID=1048 [URL accessed July 2014].


